EC2 Disk Overview
Amazon’s EC2 service is really neat, but its disk subsystem has some peculiarities that are not initially obvious. Up until very recently, root directories (’/’) at EC2 were limited to 10Gb, a limit defined by the maximum size of an Amazon Machine Image (AMI), essentially a template of an EC2 instance. In order to use more disk space, Amazon provides ephemeral disks that one can format and mount anywhere on the file system. However, in order to get persistent storage, one has to use network-attached EBS volumes, a sort of limitless in capacity but bound in I/O wonder of Amazon architecture. There are clear performance implications in choosing how to configure an EC2 instance’s disk subsystem, so I recently benchmarked some various ephemeral and EBS RAID configurations.
Ephemeral disks
Pros:
- Free (included in cost of EC2 instance)
- Stable, predictable performance on par with a standard physical hard disk
- Abundant storage (up to 1.7TB on a c1.xlarge)
Cons:
- Ephemeral - if the instance shuts down, all data is lost
- Average random seek performance (6-7ms seek times per spindle)
EBS Volumes
Pros:- "Highly available" - AWS claims to provide redundancy and a lower failure rate than physical disks
- Portable - an EBS volume can be connected to any instance in a single availability zone
- Backups - can easily create snapshots
Cons:
- Extremely variable performance - seek times can range from .5ms to 10ms+
- Maximum throughput of 1Gbit/s
- Costs associated with storage and I/O
Testing
For this testing, c1.xlarge instances were used due to their high CPU performance, memory capacity, "I/O Performance: High" (according to Amazon), and 4 available 450GB ephemeral disks.I created 5 c1.xlarge instances with 5 configurations: 4xEphemeral RAID0 local disk, single EBS, 2xEBS RAID0, 4xEBS RAID0, 8xEBS RAID0. All instances were created in the us-east-1b Availability Zone and all EBS volumes attached were newly created specifically for this test. Testing was done using bonnie++ on fast mode (-f flag, skips per-char tests).
mdraid was used to create RAID0 arrays with a chunk size of 256k, for example:
mdadm --create --verbose /dev/md0 --level=0 -c256 --raid-devices=2 /dev/sdi1 /dev/sdi2
blockdev is used to set the read-ahead buffer to 64k:
blockdev --setra 65536 /dev/md0
XFS is used as the filesystem:
mkfs.xfs -f /dev/md0
Finally the RAID array is mounted with noatime at /mnt/md0:
mkdir -p /mnt/md0 && mount -o noatime /dev/md0 /mnt/md0
I logged the results of Sequential Writes, Sequential Reads, and Random Seeks. bonnie++ was run 6 times on each instance.
bonnie++ averages
|
Sequential Throughput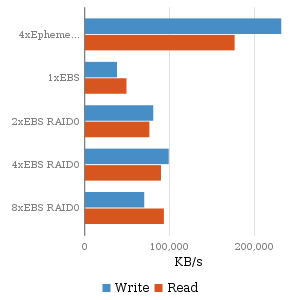 |
The EBS results are a little less predictable. A single EBS does not have the throughput of a single ephemeral drive. The 2xEBS RAID0 shows almost twice the throughput of the single EBS volume, while the 4xEBS RAID0 and 8xEBS RAID0 instances do not scale much higher than the 2xEBS RAID0 instance for throughput. Since EBS volumes are access via network, this indicates that EBS volume throughput is limited by the gigabit interface.
Random Seek Times
|
Random Seeks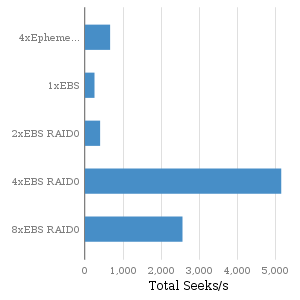 |
EBS random seek performance, however, is not easily predictable. The volumes that make up the 4xEBS RAID0 instance clearly are higher performing than those of the other instances. Is EBS performance more of a property of the EBS volumes or the instance?
Another interesting result I noticed (but didn’t include in these graphs) is the deviation of performance from one run to another. The standard deviation between the runs was much smaller for the ephemeral drives than for the EBS volumes.
Swapping EBS volumes to identify bottleneck
I attached the two EBS volumes from the poorly performing 2xEBS RAID0 instance to the fast 4xEBS RAID0 instance and re-ran the tests. If the performance of the two EBS volumes improves when attached to the 4xEBS RAID0 instance, then perhaps we can attribute the difference to the instances, but if the performance is the same, then we can blame the EBS volumes themselves.Results:
| Configuration | Seq W/s | Seq R/s | Ran. Seeks | Seeks/EBS |
|---|---|---|---|---|
| 2xEBS Volumes on 4xEBS Instance | 110146 | 91555 | 795.6 | 397.8 |
The I/O channel is more or less saturated, but we still see the same poor random seek performance that the 2xEBS RAID0 instance exhibited with these two same EBS volumes. This leads me to believe that the seek times are inherent to the individual EBS volumes themselves.
To confirm, I mounted the high performance volumes from the 4xEBS RAID0 instance and the poorly performing volumes from the 2xEBS RAID0 instance to the 8xEBS RAID0 instance. I wanted to test if we can “export” the high the performance from the 4xEBS RAID0 instance to the 8xEBS RAID0 instance. I then repeated the bonnie++ tests.
Results:
| Configuration | Seq W/s | Seq R/s | Ran. Seeks | Seeks/EBS |
|---|---|---|---|---|
| 8xEBS RAID0 (benchmark for instance) | 39238 | 90403 | 1629 | 204 |
| 2xEBS Volumes on 8xEBS Instance | 108108 | 94189 | 735.3 | 368 |
| 4xEBS Volumes on 8xEBS Instance | 125459 | 93972 | 9285 | 2321 |
Once again, the 2xEBS volumes are still poorly performing and the previously fast 4xEBS volumes are still fast (they were even faster than before). At this point, the evidence is pretty clear that the performance of the EBS volumes are inherent to the volume itself, since they exhibit the same level of performance regardless of the EC2 instance that mounts them.
Instantaneous EBS performance over time
I wanted to test if EBS performance varies over time, so I created a new c1.xlarge instance, in another EC2 availability zone. This new c1.xlarge instance had 4 new EBS volumes, configured as a 2xEBS RAID0 array (two EBS volumes unused) and a 4xEBS RAID0 array (all four used). I ran bonnie++ over two weeks.Results:
| Configuration | Seq W/s | Seq R/s | Ran. Seeks | Seeks/EBS | |
|---|---|---|---|---|---|
| 2xEBS RAID0 | 107513 | 92681 | 2642 | 1321 | (week 1) |
| 4xEBS RAID0 | 112326 | 94844 | 7829 | 1957 | (week 1) |
| 2xEBS RAID0 | 35799 | 68619 | 215 | 108 | (week 2) |
| 4xEBS RAID0 | 88012 | 92863 | 623 | 156 | (week 2) |
The same instance using the 4 same EBS volumes show a huge discrepancy in performance from week to week. During the first week, the 4 EBS volumes perform admirably. During the second week however, performance drops dramatically and the 4xEBS RAID0 volumes don’t even seem to saturate the gigabit channel. This doesn’t bode well for EBS performance predictability.
During the second week, I ran ‘iostat -x -m 240’ while I ran bonnie++ to see if I could identify the poor performance.
2xEBS RAID0:
           avg-cpu:  %user   %nice %system %iowait  %steal   %idle
                     0.02    0.00  0.47    11.99    0.02     87.51

Device:         rrqm/s   wrqm/s   r/s   w/s    rMB/s    wMB/s avgrq-sz avgqu-sz   await  svctm  %util
md0               0.00     0.00  0.00 615.20     0.00    25.42    84.63     0.00    0.00   0.00   0.00
sdi1              0.00     0.06  0.00 307.41     0.00    12.71    84.67   148.55  483.20   3.25 100.02
sdi2              0.00     0.04  0.00 307.60     0.00    12.71    84.61    10.49   34.10   1.19  36.67
sdi3              0.00     0.00  0.00  0.00     0.00     0.00     0.00     0.00    0.00   0.00   0.00
sdi4              0.00     0.00  0.00  0.00     0.00     0.00     0.00     0.00    0.00   0.00   0.00
Notice the particularly poor ‘await’ time of /dev/sdi1, one of the two members of the /dev/md0 RAID0 array. Because of how poorly /dev/sdi1 was performing, the entire /dev/md0 array exhibited poor performance. During a read request, the file file system sends a request to the /dev/md0 device, and mdadm determines that it needs to split the request into two separate requests, one that goes to /dev/sdi1 and /dev/sdi2. If one of the two members of the array is poorly performing, as in this situation, it becomes a bottleneck for the entire array. (As an aside, a few hours after seeing these poor numbers, I re-ran bonnie++ on these 4 EBS volumes, and they were once again fast.)
Conclusions
These tests show a tremendous variability in EBS performance, not just between one EBS volume and another but also within a single EBS, from one point in time to another. Like CPU time on a shared server, an EBS volume's performance is dependent on how busy the entire EC2 ecosystem is. However, AWS guarantees a certain number of CPU cycles and amount of RAM in an EC2 instance; it's not clear that AWS provides a similar guarantee for EBS performance.There are a few key takeways:
- EBS volumes, even several in RAID0, have a throughput limit of 1 gigabit/second on an EC2 instance. Two EBS volumes in RAID0 have the ability to almost max out an instance's EBS I/O channel
- EBS volumes can have random seek times ranging from .5x to 10x+ that of an ephemeral disk
- Ephemeral disks in RAID0 are very fast
- It is advisable to use both a mixture of ephemeral and EBS RAID arrays, depending on the situation
- 4 or 8 EBS volumes in RAID0 seem to be enough to smooth out the peaks and valleys of individual EBS volumes' seek times
- Increasing mdadm RAID0 chunk size to 256k and setting 'blockdev --setra 65536' seems to help sustain I/O throughput even when seek times are bad. Mounting EBS arrays with '-o noatime' should also theoretically help with poor seek performance.